Easy Setup
Start monitoring
your website
in three steps.
Setup takes about five minutes. Add your website address, confirm what you want scanned, and Datashielder handles the discovery and monitoring. No code, integrations, or IT ticket required.
At a glance
~5 minutes
Your website address
Not required
Within 24 hours
The three-step setup.
Each step takes under a minute. You can pause at any point, and we will save your progress.
- 01Account
Create your workspace.
Sign up, name your workspace, and invite teammates now or later. Everyone you add can see the same scans, findings, and reports.
Under a minute · Google sign-in
- 02Website
Add your website.
Enter your primary domain, such as example.com. Datashielder starts mapping related public hosts and pages, helping surface portals, apps, admin areas, staging sites, and older properties you may want to monitor.
No lists to build
- 03Launch
Confirm scope and launch.
Review what we found, select the hosts you are authorized to monitor, and start the scan. Your first results arrive within 24 hours.
First findings within 24 hours
The actual interface.
Not a mockup — these are real screens from the product. Every monitored target gets its own command centre with severity scoring, a full scan timeline, and a triage-ready report feed.
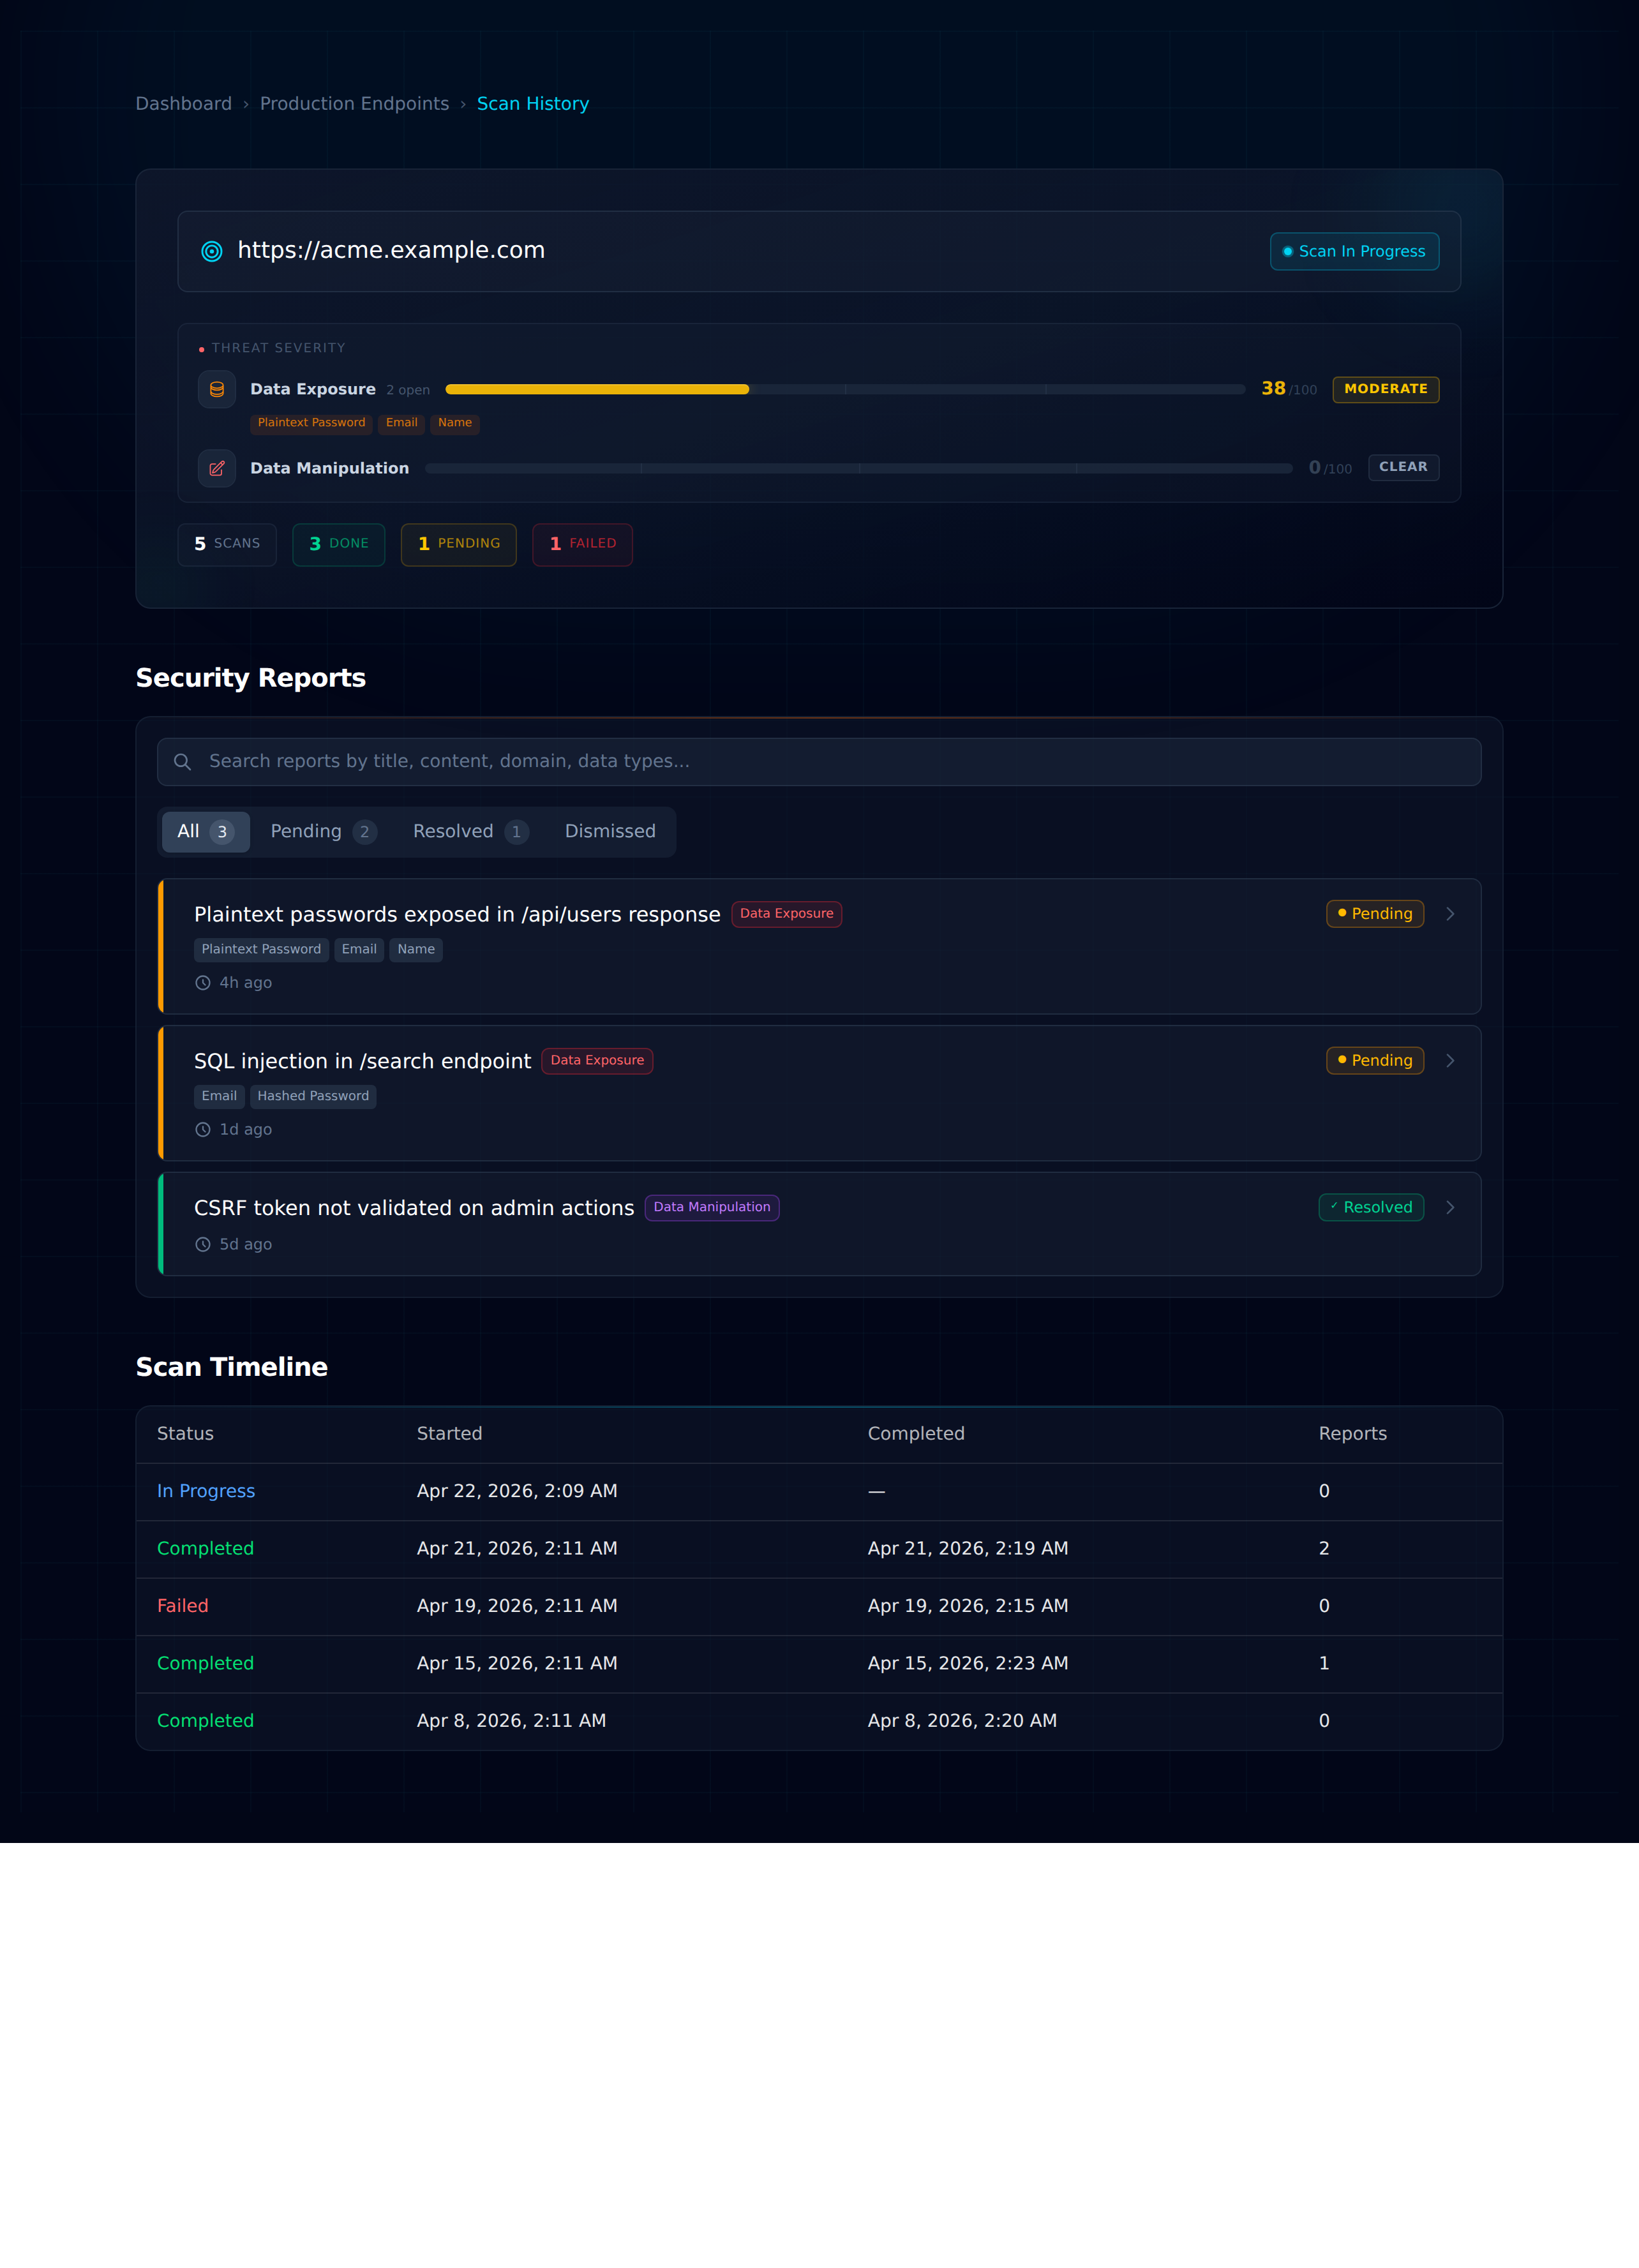
Every domain gets its own command centre.
Domain status, threat severity, scan timeline, and triaged findings on a single screen.
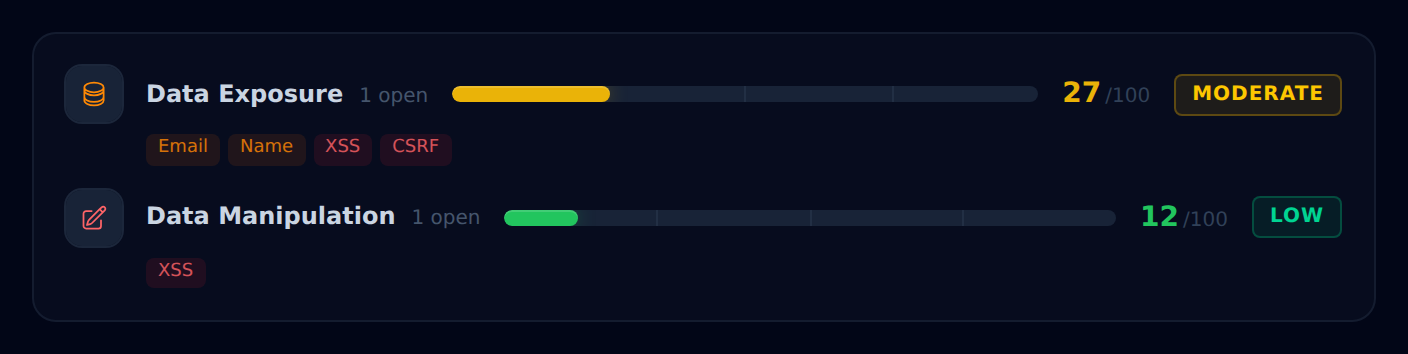
Risk, at a glance.
Each detector category gets a 0-100 score and colour-coded severity. Quick to read, quick to prioritise.
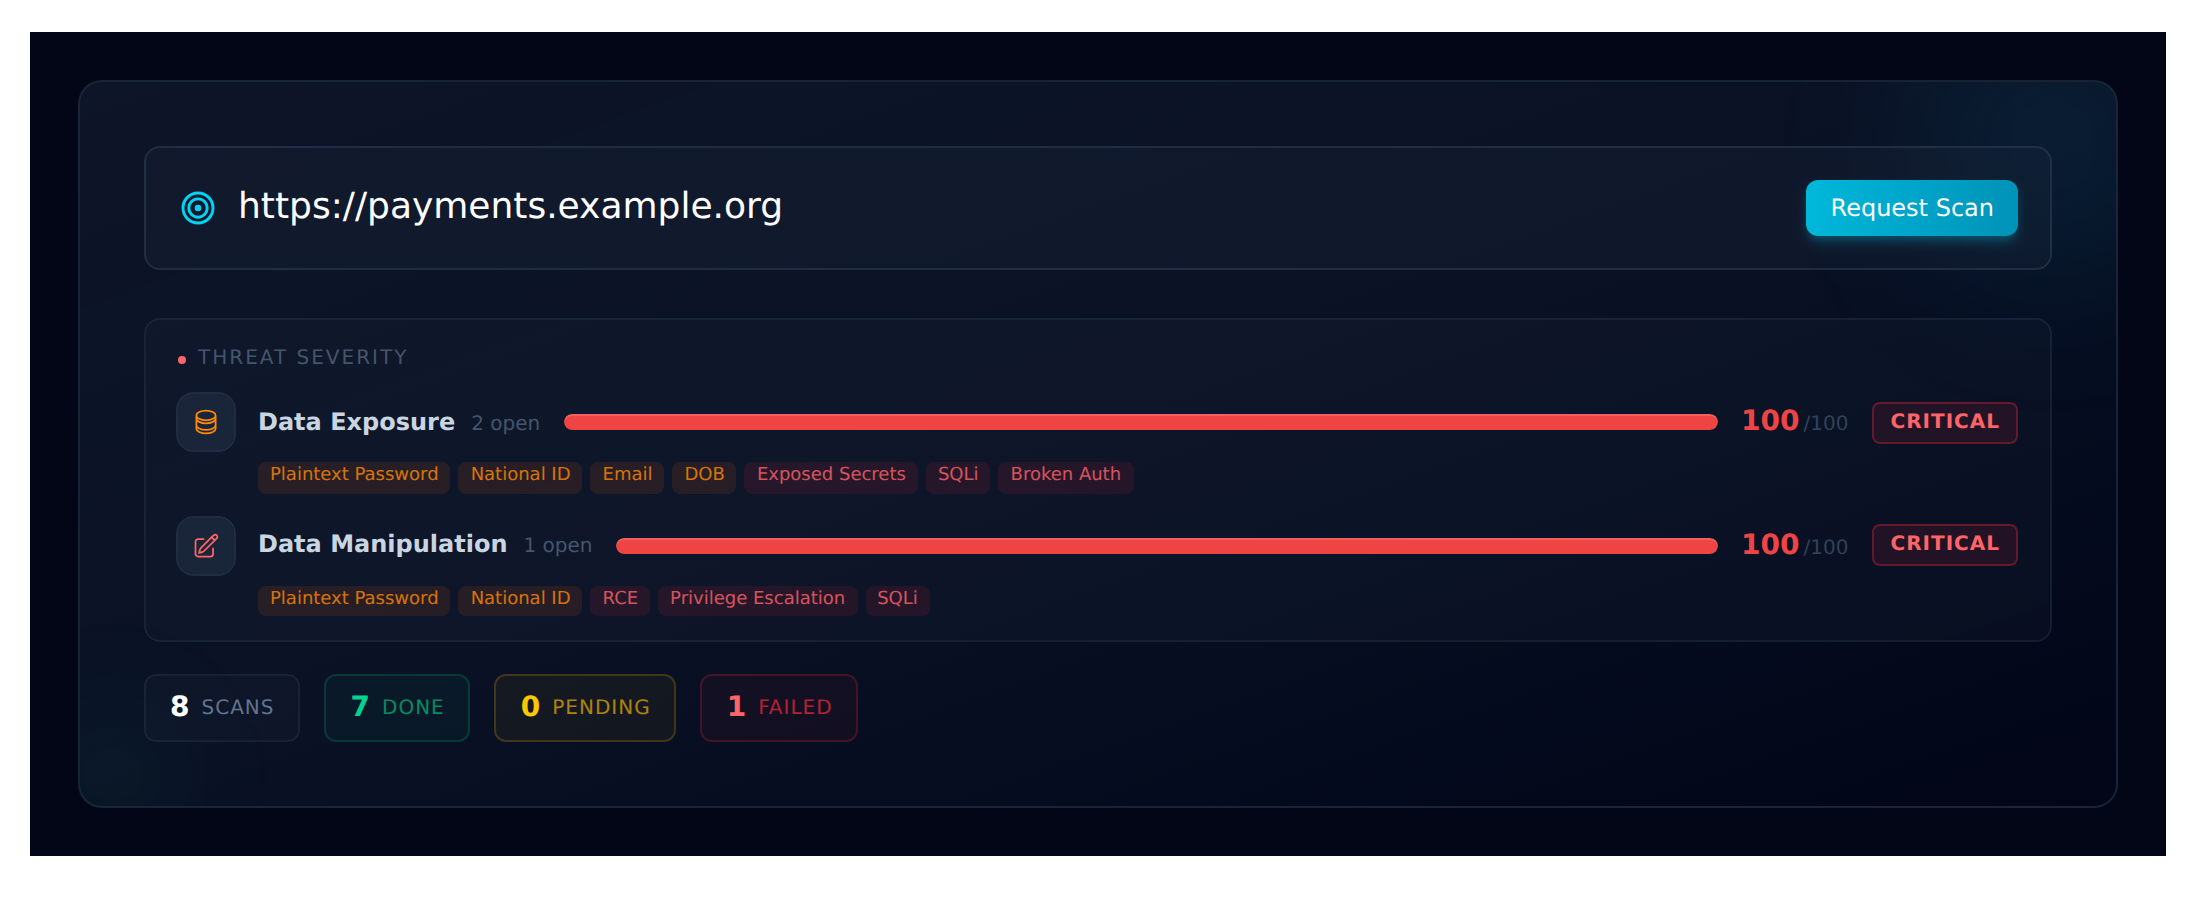
Monitored host, at a glance.
URL, last scan state, pending count, and severity for every detector — in one header strip.
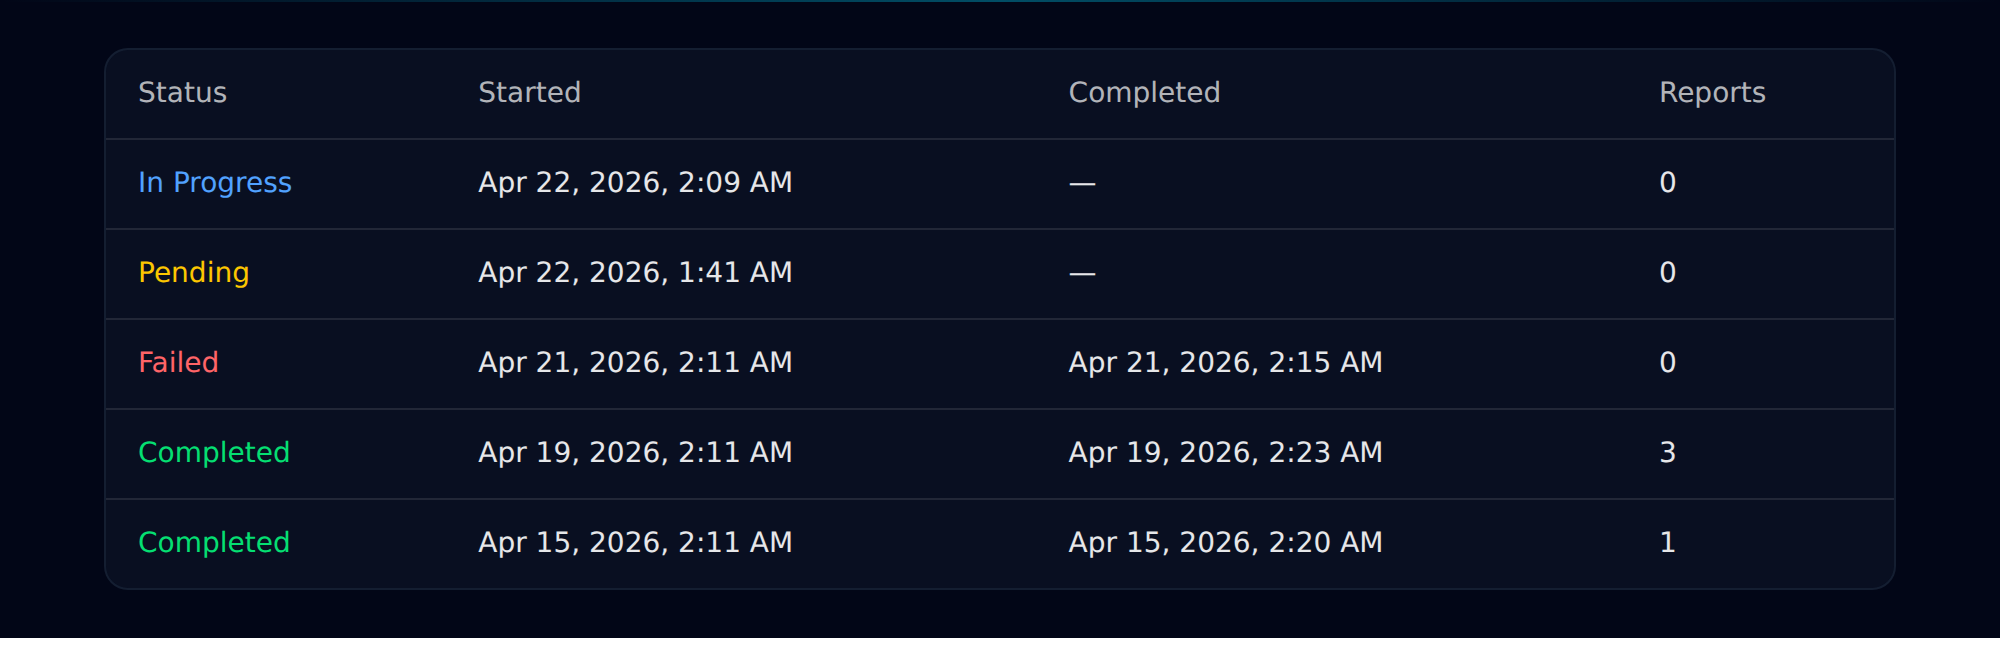
A clean audit trail.
Every scan is recorded — in progress, completed, failed — with exact start and finish timestamps.
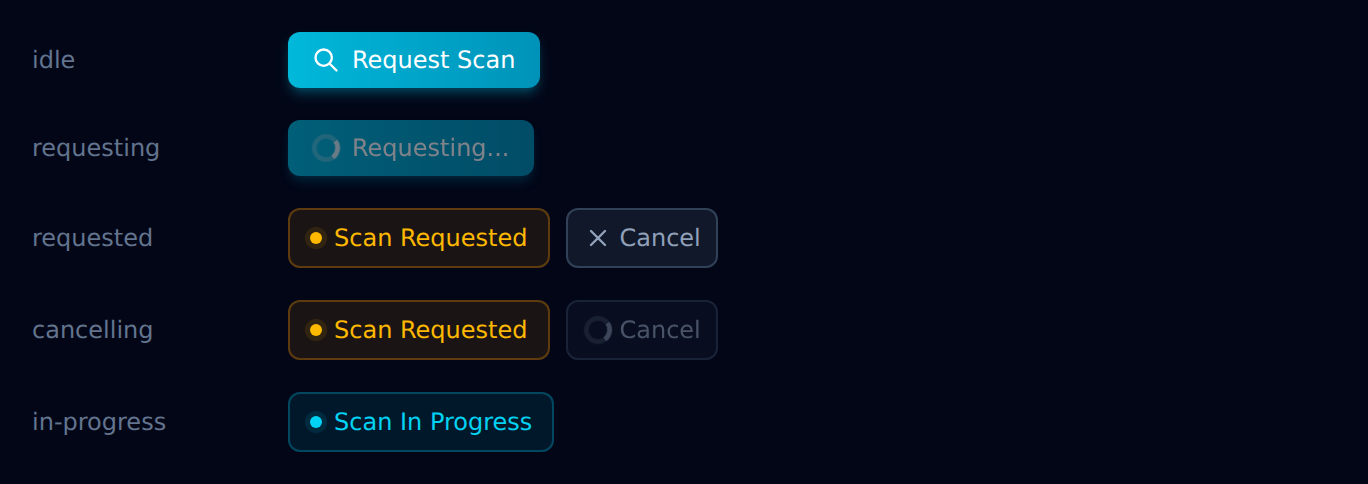
Scan on demand.
Kick off an ad-hoc scan between scheduled runs. Every state of the button is reachable in one place.
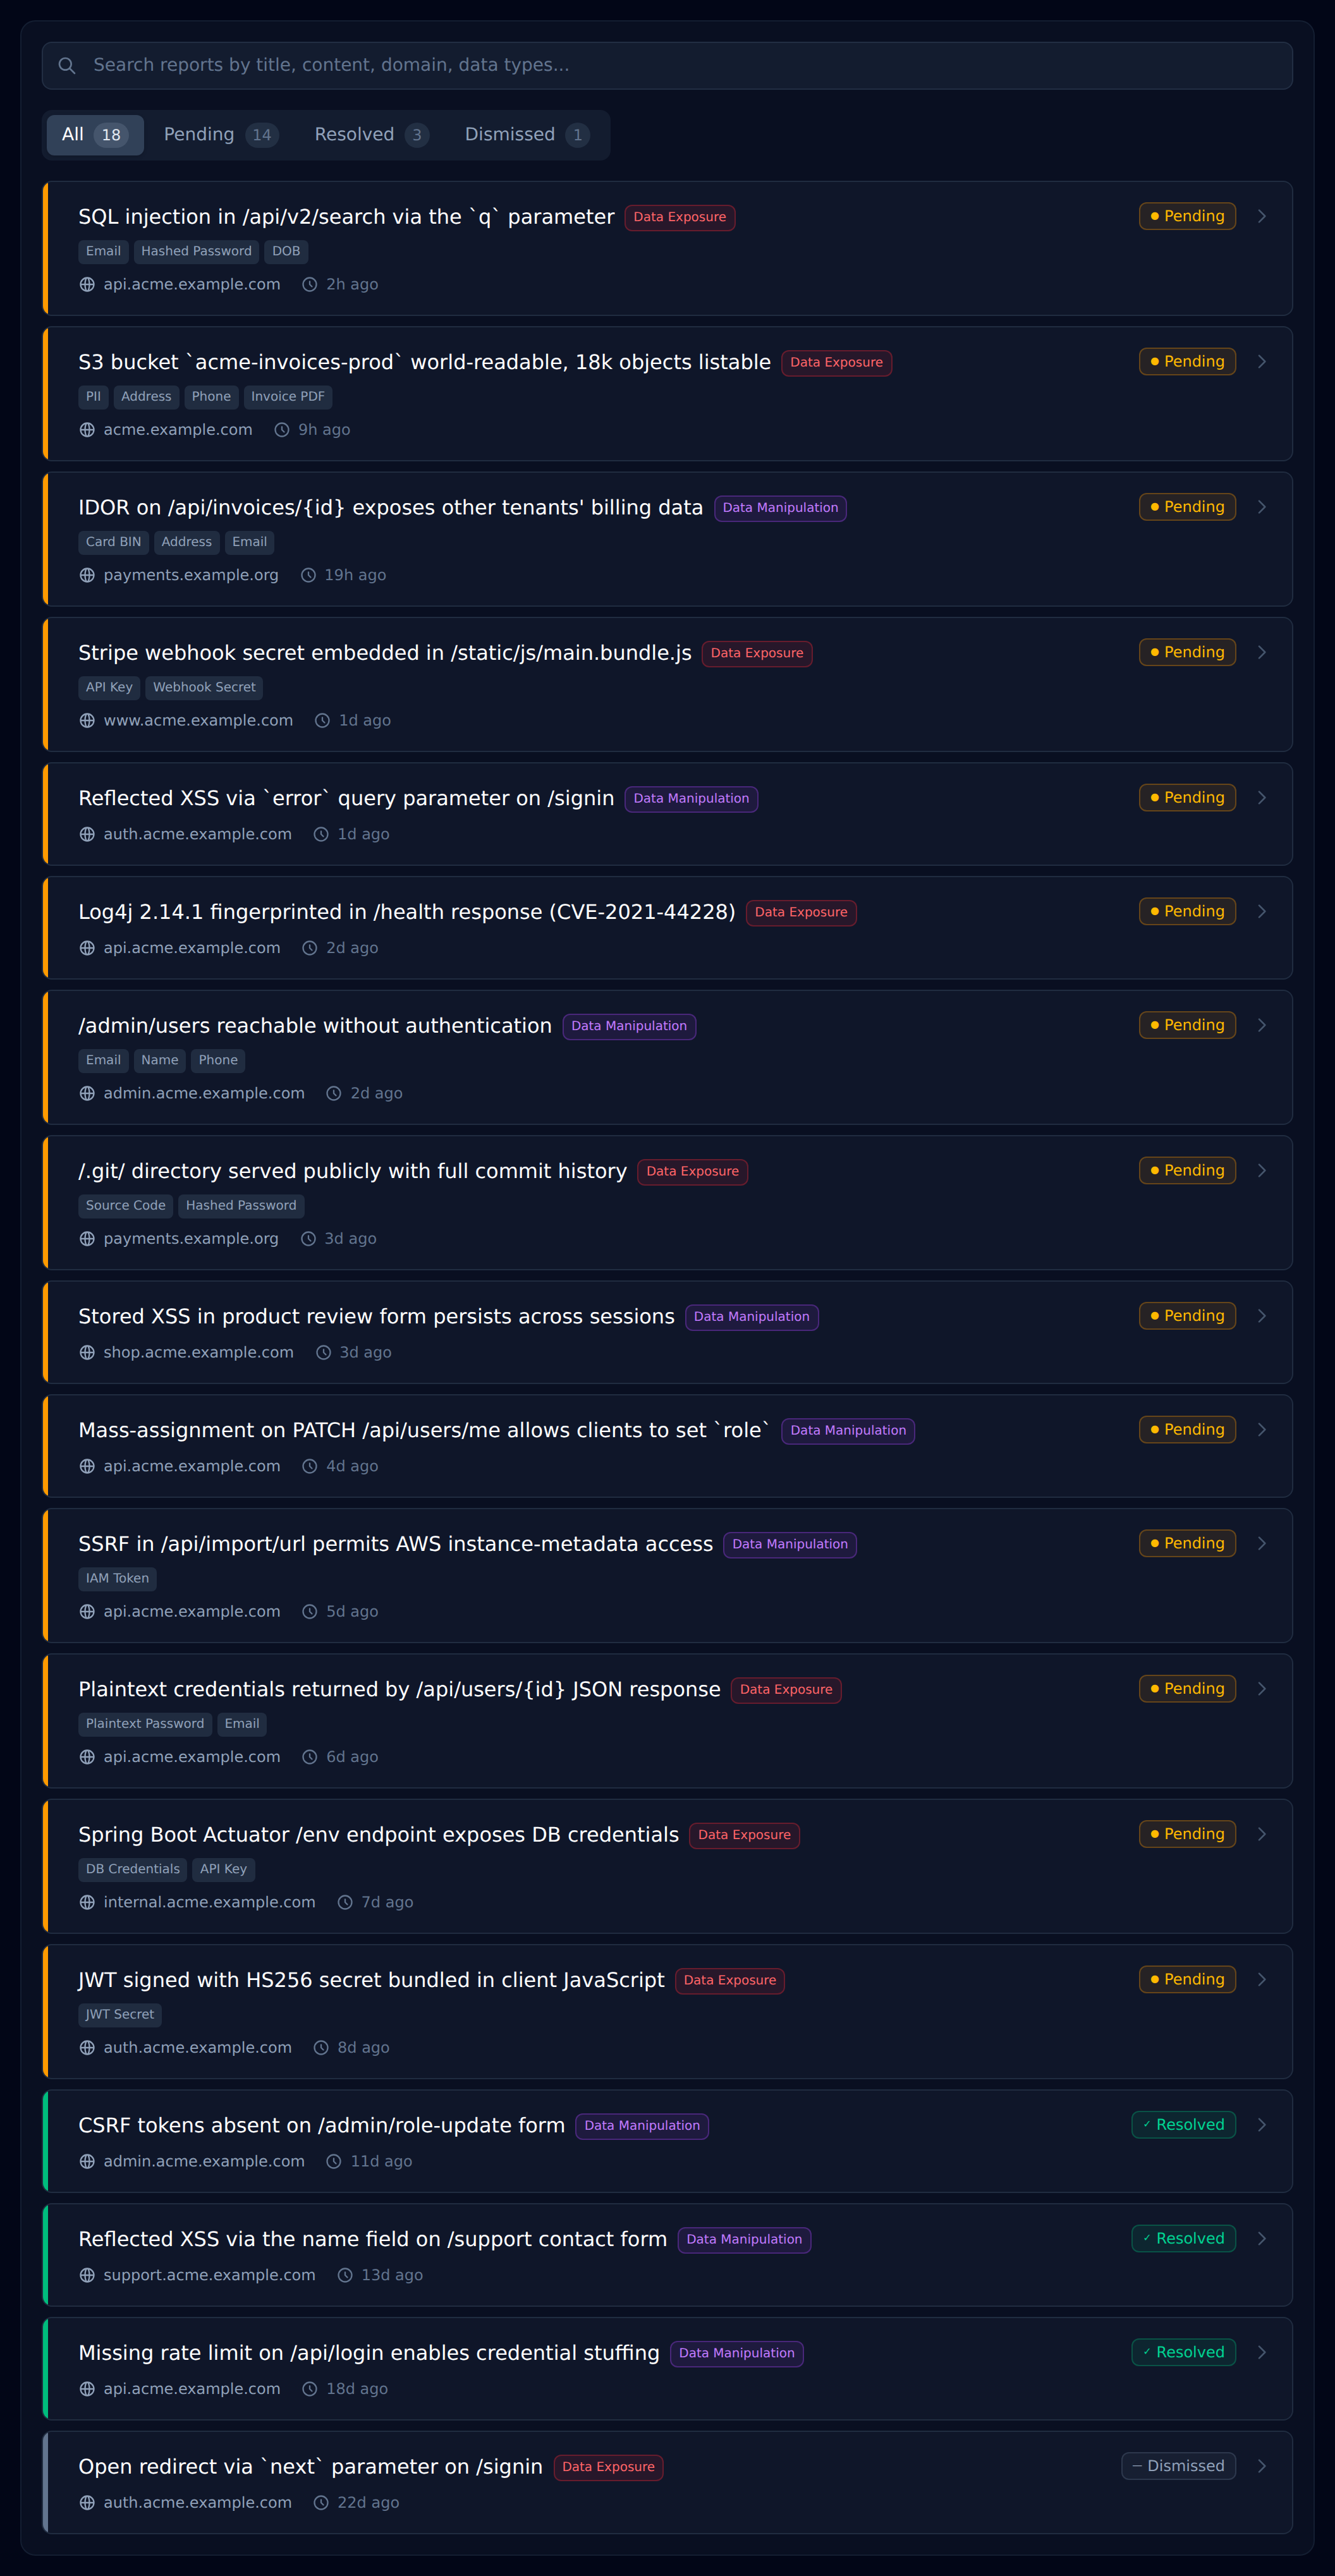
Every finding, triaged.
Pending, resolved, or dismissed — filter by state, category, or domain. Built to be worked through, not stared at.
Ready when you are
Start your first scan in five minutes.
No code changes. No integration project. Add your website address, confirm scope, and Datashielder starts monitoring.